
The market volatility continues. How to determine when the pullback is over?


Original Author: Murphy, On-chain Data Analyst
How to Determine if a Pullback is About to End?
There are many methods to determine if a short-term pullback is about to end. As mentioned before, analysis can be conducted from different perspectives such as chip structure, financial pressure, sentiment feedback, etc. Today, I will share another method that I often use and find very effective, which is to observe the cost basis changes of different time cohorts as a reference point.
Before discussing the logic, let's first look at a case study—the bottom judgment of a large cycle
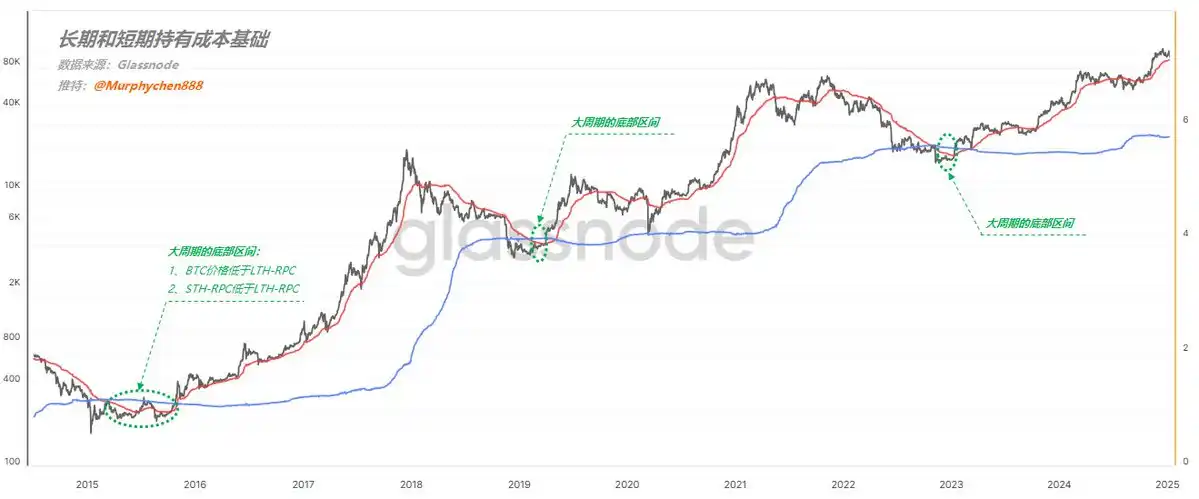
In Figure 1 below, the blue line represents Long-Term Holder's Average Cost Basis (LTH-RPC), the red line represents Short-Term Holder's Average Cost Basis (STH-RPC), and the black line is BTC's price.
(Figure 1)
Pay attention to the area I have circled in green with a dotted line. As long as the following 2 conditions are met simultaneously:
- Condition 1, BTC price is below LTH-RPC
- Condition 2, STH-RPC is below LTH-RPC
This stage is the bottom range of the large cycle and is also an excellent opportunity to buy the dip!
The underlying logic is as follows:
First, when the BTC price falls below the LTH-RPC, it means that the average cost of long-term holders is at a loss. This indicates that the price is severely undervalued, and the market bubble has almost completely burst.
Second, in the vast majority of time, the longer the chip holding period, the lower the relative cost. Therefore, it is extremely rare for STH-RPC to be lower than LTH-RPC.
It indicates that during the price decline, there were a large number of loss-exiting short-term holders, but new short-term holders entered to buy the dip. After frequent turnover, the cost of short-term chips was actually pulled below the cost of long-term chips. This is a phase of oversold prices, signaling the bottom of the panic sentiment. Following the logic above, we can also apply the same reasoning to determine the duration of a bull market pullback.
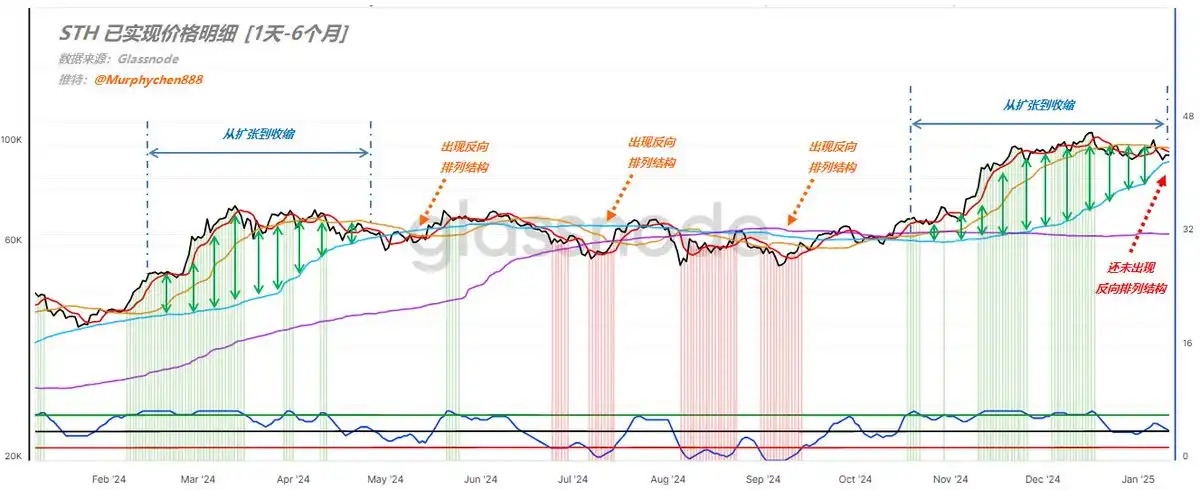
Figure 2 below lists the cost bases for: 1d-1w (red line), 1w-1m (yellow line), 1m-3m (blue line), 3m-6m (purple line)
(Figure 2)
First, let's look at February to May 24th, which happens to be the process from the start of a trend to decay and a pullback. The entire process is accompanied by the widening and narrowing of the distance between the blue line and the red line (as indicated by the green arrows in the image);
Eventually, the blue line ran to the top, while the red line was at the bottom, meaning that the relative short-term cost of chips was lower than the relative long-term cost of chips. I call this phenomenon the "reverse arrangement structure" of long-term and short-term costs.
I marked three points in the image with orange dashed lines, all of which show the formation of a blue, yellow, red arrangement from top to bottom, or a purple, blue, yellow, red arrangement, representing the relative bottoms during pullbacks.
So, the current trend is also transitioning from rapid expansion to gradual contraction, but the blue line is still below. If we are to see a market restart in the short term, perhaps a "reverse arrangement structure" needs to be formed first. However, after this period of turnover, the blue line is already very close to the red and yellow 2 lines. As long as there is another period of consolidation, the structure can form, thereby meeting the conditions for forming a relative bottom.
PS: Of course, it would be best to form a purple, blue, yellow, red "reverse arrangement structure," but this would require a longer turnover time (at least 4-5 months).
Summary:
Based on the change in the cost base of different time groups as the basis for judging the time of a pullback, the higher the relative cost of long-term chips, the closer we are to the bottom once a blue, yellow, red "reverse arrangement structure" is formed from top to bottom. This indicates that turnover is sufficient, sentiment is close to the bottom, and the pullback time is coming to an end.
The content shared in this article is for communication and research purposes only and should not be construed as investment advice.
You may also like

The cryptocurrency industry has become a traditional industry
Chip frenzy cooling down? Morgan Stanley's Wilson: Funds are shifting towards AI supercomputing giants like Microsoft and Amazon
$10,000 in TRUMP Token vs. $10,000 in Nasdaq: The "Trump Trade" That Actually Worked in 2026
Morning Report | Vitalik outlines Ethereum's long-term roadmap, Lean Ethereum will become the third major iteration; SK Hynix seeks to attract more AI investors by listing in the U.S
The impact of OUSD on Circle, Tether, and Paxos: not a single negative factor, but a more complex reshaping of competition
Li Feifei's latest long article: When video generation, robots, and NVIDIA all claim to be world models, we need a taxonomy
Blaming the desolation of the cryptocurrency world on the rise of AI is a form of intellectual laziness
Strategy Founder: The Next 10 Years of Bitcoin
Forbes Special Report: Stablecoin cross-border payments are faster now, but not cheaper yet
A valuation of 8 billion dollars, doubling in 8 months! What makes the crypto-friendly bank Erebor Bank stand out?
340 billion valuation: Li Yanhong's largest IPO, a seat in Kunlunxin's shares is hard to come by
Stablecoins are the "royalists" of the crypto world: Open USD brings the old currency system into play
Cape Verde 2-3 Argentina: The Underdog Team That Stunned the World in Defeat
Cape Verde's run ended in a 3-2 defeat to Argentina, but their journey — three unbeaten draws, one heroic goalkeeper, and a fight that pushed the defending champions to the brink — is the kind of story markets recognize too: small caps can rattle blue chips long before anyone expects it.
Semiconductor stocks plummet, yet Anthropic wants to create a 2nm chip
Where is Zhao Changpeng's billion-dollar investment going? YZi Labs' investment landscape fully revealed
Ethereum Foundation Report: A Basic Guide to Ethereum for Governments and Financial Institutions
A pre-announced harvesting case: After the cryptocurrency price dropped by 99%, the public chain Saga exited to transform into AI
When American giants collectively "defect" from Chinese AI models
The cryptocurrency industry has become a traditional industry
Chip frenzy cooling down? Morgan Stanley's Wilson: Funds are shifting towards AI supercomputing giants like Microsoft and Amazon
$10,000 in TRUMP Token vs. $10,000 in Nasdaq: The "Trump Trade" That Actually Worked in 2026
Morning Report | Vitalik outlines Ethereum's long-term roadmap, Lean Ethereum will become the third major iteration; SK Hynix seeks to attract more AI investors by listing in the U.S
The impact of OUSD on Circle, Tether, and Paxos: not a single negative factor, but a more complex reshaping of competition
Li Feifei's latest long article: When video generation, robots, and NVIDIA all claim to be world models, we need a taxonomy